 Clear Cortex
How to pick the winning ad without trusting the number that lies
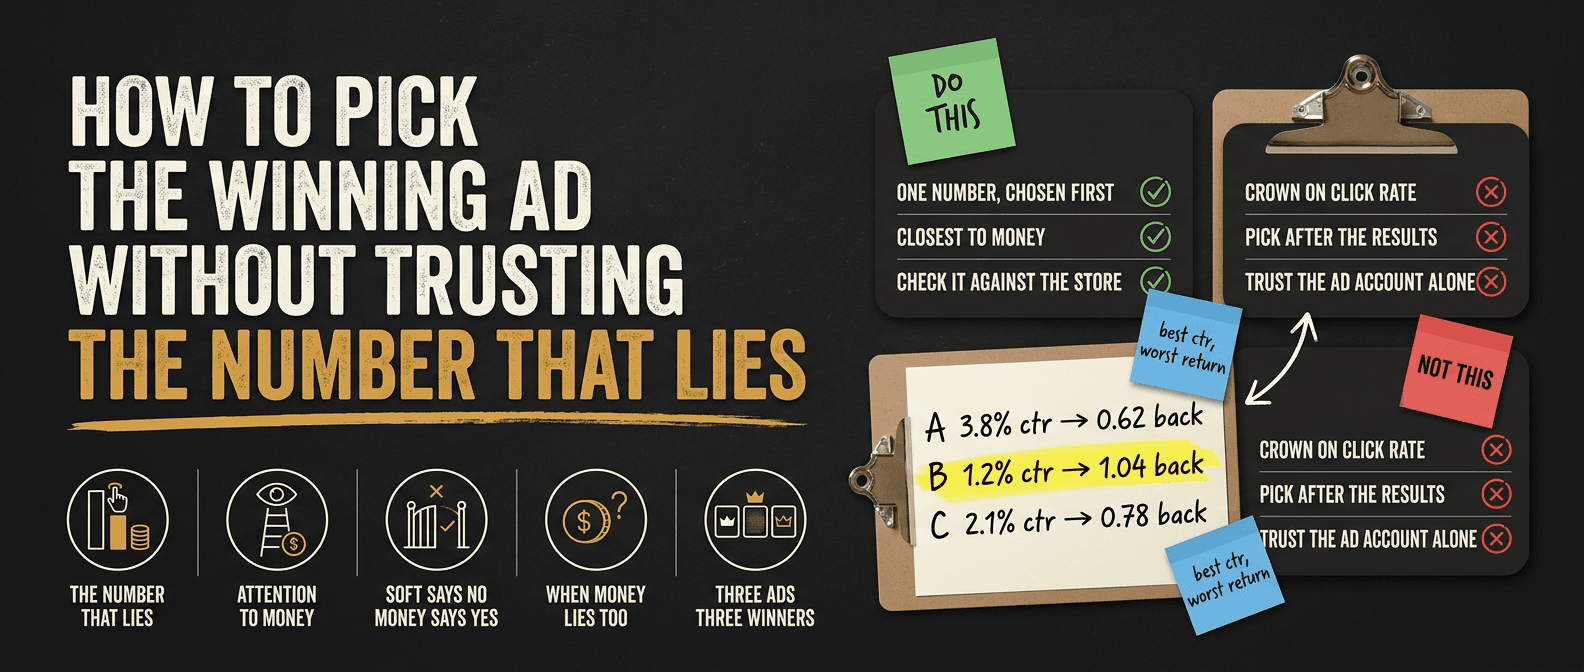
the ctr kept rising. the cpa rose almost 30%.
i went looking for how people decide which ad won a test, and counted 17 versions of the question across 14 separate threads. the thing i did not expect was the pile sitting next to it: nine threads where somebody describes a creative with a click rate that looked healthy and nobody buying. one group is asking which number to trust. the other group trusted one.
the question arrives as a list, every time:
"what metrics do you use to decide winners: hook rate, hold rate, ctr, cpa, trials/purchases, roas?"
"also what tools are you using to make/test creatives and what metrics do you pay the most attention to before deciding whether to kill an ad or keep pushing it?"
"for people who have tested it: where have you seen the bigger impact - paid-social ctr or product-page conversion?"
"how did it compare to real ugc or before/after static images in terms of ctr and cpl?"
"do you cut on cpa, on roas, or do you look at what size orders a creative brings in?"
the list is long because every number on it is real and every one of them moves. the trouble is that they disagree, and when they disagree you will pick the one that agrees with the ad you already liked. the one most people end up picking is the one that shows up first, and the one that shows up first is the one furthest from money.
so here is the whole answer, in the order to use it. one line running from attention to money, the one step on it you actually decide on, what the rest are for, the three ways the money figure lies as well, and all of it run on a test where three videos each win on something different. the easy numbers are not useless. they are the wrong thing to crown a winner with, and crowning on them is how the scaling budget ends up behind the creative that sells least. nothing is held back and there is no gate on any of it.
the cover on this piece was made in clear cortex for about 8p, on the cheapest model that could spell the headline. that's the studio i'm building, and it's the only ask in this piece: https://clear-cortex.com/?src=x-which-number-top
The number that looks best can sit on the creative that sells least
start with the account in the first line, because the person who ran it described it better than i could. the click rate went up. "cost per click stayed reasonable, volume was healthy, and on paper this looked like one of the better performing months we had run." and then: "then finance flagged that cost per acquisition had crept up almost thirty percent over the same stretch, which made no sense next to a rising ctr unless something was inflating clicks without inflating real interest."
their own summary of it is the whole problem in one sentence: "it is dropping performance while making the surface level metrics look like things are improving, which might be the most frustrating combination i have dealt with this year."
that account is not unusual. it is one of nine. somebody running an app: "the ads look elite on every platform metric and convert basically nobody." somebody selling a $99 gadget: "near zero sales despite the ad account looking healthy". somebody in jewellery: "the weird part is that the funnel signals are good", then a list of healthy numbers, then "but purchases remain low."
so why does the easy number keep landing on the wrong ad? there are two reasons, and neither of them is that the platform is broken.
the first is that a click measures a reaction, not a buyer. a click rate tells you how many of the people who saw the ad were interested enough to tap. it says nothing about whether they were the people who buy. and the ad itself decides which of those it attracts. a video that opens on a mystery, holds the product back, or looks like a post rather than an ad collects curious people, and curious people click. a video that shows the product and the price in the first three seconds sends away everybody who was never going to pay — its click rate is lower because it is doing its job. put both into one test and crown on click rate, and you have built a system that rewards the creative asking the least of the viewer.
people in the middle of this already suspect it. one of the sharper questions in the pile: "do social proof hooks give you lower cpa while relatability hooks bring in more clicks?" that is exactly the split. a hook can win the click and lose the sale, and the dashboard will show you the click first.
the second reason is volume, and it is the one that actually decides what people use. a test video on a small daily budget, with a few thousand impressions, has dozens of clicks and a handful of purchases. the click rate has had dozens of chances to settle down; the cost per purchase has had four. so by day three the click rate looks decided and the purchase figure still looks like noise — and when you are staring at a spend line going up, you use the number that looks like an answer. it gets picked because it arrives first, not because it is right.
one vendor published a large dataset claiming the soft metrics and return on spend run in opposite directions, and asked the room: "are you finding ctr/hook rate and roas moving in opposite directions too, or is this an artifact of how the dataset is weighted?" i cannot check their data and i am not going to lean on it. the claim here is narrower and it does not need it: they are measuring different things, and when they disagree, only one of them is money.
Every number sits on a line between attention and money
lay the list out in the order a customer goes through it and it stops being a menu:
- hook rate — of the people who were shown the video, how many were still there after the first few seconds.
- hold rate — how many stayed for most of it.
- click rate — how many tapped through.
- add to cart, or checkout started — how many did something on the page.
- purchases, and cost per purchase — how many paid, and what each one cost you in spend.
- return on ad spend — what those purchases were worth against the spend.
- blended — what the whole business took in against everything it spent on ads, read from the store rather than the ad account.
two things change as you go down that list, and they change in opposite directions. each step is closer to money, and each step has fewer events in it. thousands of people see the ad, hundreds watch past the start, dozens click, a handful buy. the top of the line is fast and plentiful and tells you almost nothing about money. the bottom is exactly money and arrives slowly.
that trade is the entire decision, and it gives a rule you can actually use:
decide on the step closest to money that your budget produces enough of, per ad, to read.
not the step that is most exciting, not the step your last agency reported, and not a different step for each video depending on which one looks good. one step, chosen before the test launches, and every creative in the ad set judged on it.
"enough to read" has a floor, and i wrote the arithmetic out in full in the piece about testing without paying for an answer you never get — roughly ten conversions per creative per week before the gaps between ads are bigger than the week-to-week wobble of one ad against itself. take that as given here.
which means your budget picks the step, not you. do the sum before launch. say each creative in the ad set gets $50 a day — $350 a week. at a $40 cost per purchase that buys about nine purchases a week, which is right on the floor. at $10 per add to cart the same money buys thirty-five carts. at 80 cents a click it buys over four hundred clicks. same video, same week, same spend: nine events at the bottom of the line, four hundred at the top.
that is the trap in one sum, and it is why this is worse on a small budget rather than better. the less you spend per creative, the further up the line you are forced to read, and the further up you read, the less the thing you are reading has to do with money. a big account can afford to decide on purchases. a small one gets pushed towards the click rate by its own budget — which is exactly where the lying happens.
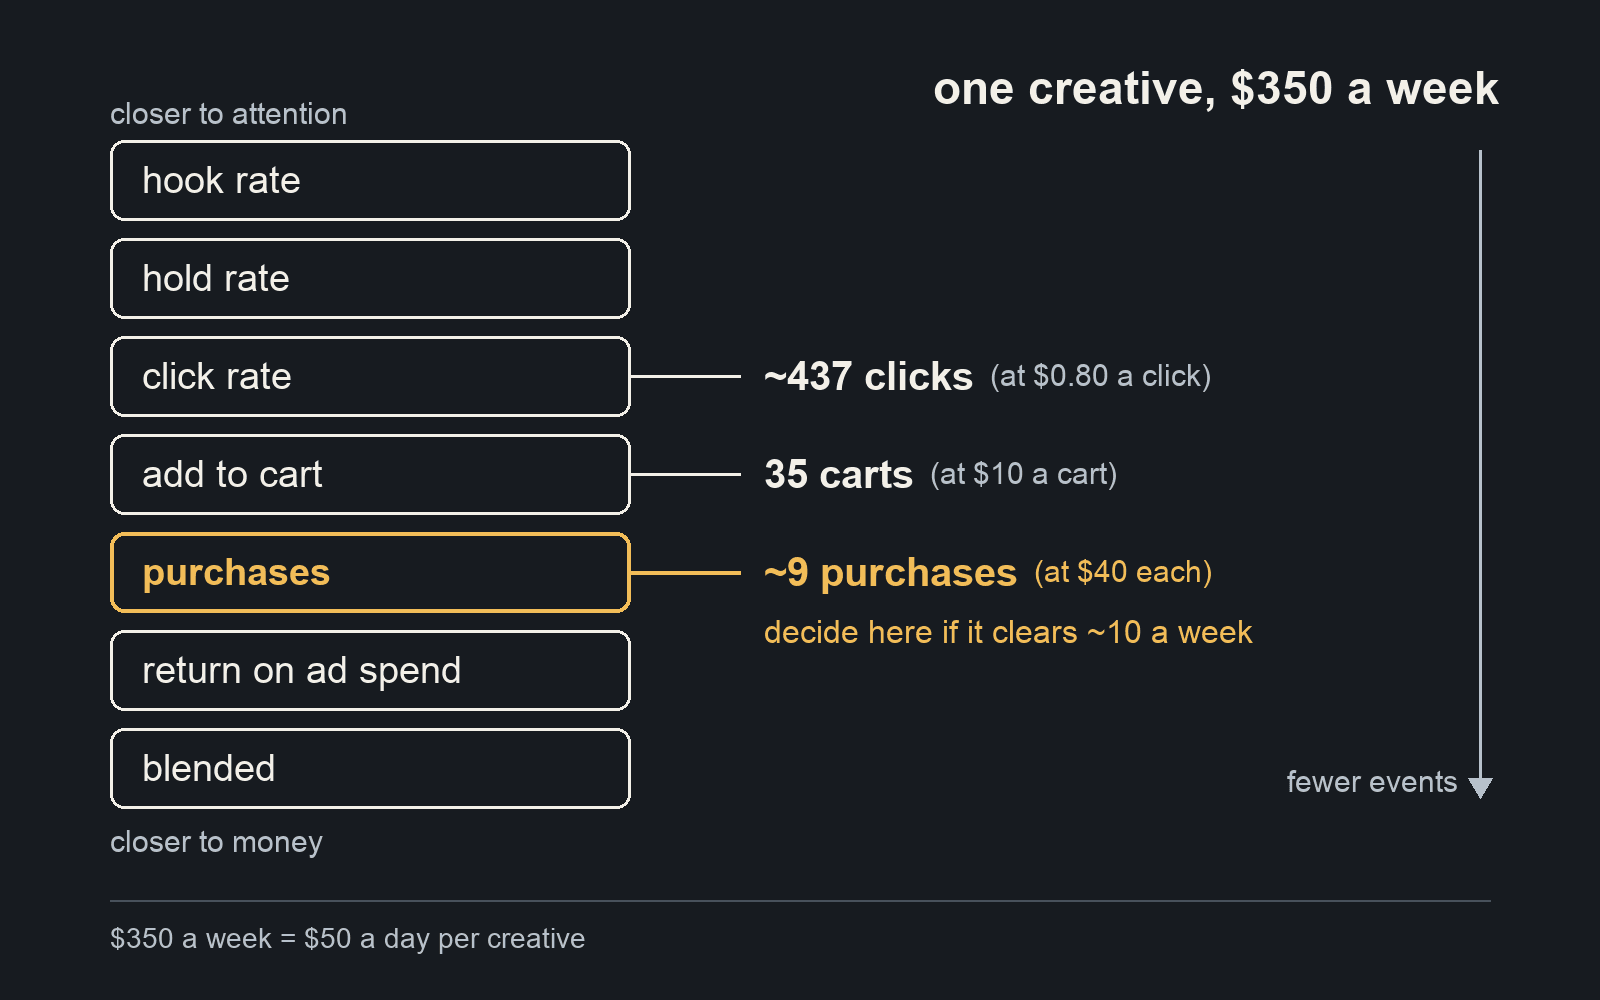
Planning arithmetic, not measured results: unit costs are illustrative. Put your own cost per click, per cart and per purchase in.
now run it on a real budget. one person described theirs exactly: "about $150/day, one cbo campaign, broad targeting." and then the consequence: "at this budget i get a handful of purchases a week and never leave learning."
a handful of purchases a week across the whole campaign means no single creative is getting anywhere near ten. so purchases cannot be the step that decides between ads on that account — not because purchases are the wrong thing to care about, but because there are not enough of them per ad to mean anything yet.
so you move up one step, not six. add to cart or checkout started happens several times as often as a purchase and sits right next to it. you judge the test on that, and then you confirm the winner on purchases once it has had the budget to produce some. what you do not do is jump all the way up to the click rate because it was the first thing on the screen that looked settled. every step you climb buys you speed and costs you truth, so climb as few as the budget forces and no more.
and a step is judged against the step under it, not against a benchmark. somebody asked "is a ~3.5% atc rate genuinely bad for a $99 impulse-adjacent physical product, or is my bar wrong?" — and there is no universal bar. the only question an add-to-cart rate has to answer is whether enough of those carts turn into purchases at a price your margin can stand. if they do, 3.5% is fine. if they do not, 7% would not save it.
Soft numbers can say no. Only the money number can say yes
none of this means ignoring the easy numbers. it means using them for the job they are actually good at, which is saying no.
if almost nobody gets past the first seconds of a video, it is not going to sell to the people who left. that read is fast and it is honest, because there is no version of events where an ad nobody watched quietly turns out to be the winner. so a soft number is allowed to disqualify an ad.
what it is not allowed to do is qualify one. a high click rate tells you the ad got attention. it does not tell you the attention was worth paying for. somebody put the distinction in one line, about an account running a 5% click rate on cheap clicks: "a 5% ctr with sub-$1 clicks says the ads create interest; it doesn't prove purchase intent."
so the soft numbers are a floor and the money number is the ranking. a creative has to clear the floor to stay in the ad set. once it has, the floor has done its job and it gets no further vote.
set the floor loose — well below the rest of the test, not merely below average. a floor set at the middle of the pack throws out exactly the ads that filter — the ones with a lower click rate because they show the price up front — and those are often the ones that were going to win on money.
the soft numbers' other job is explaining a result after you have it, and it is a genuinely useful job. where people fall out tells you what to fix: leave at the start and it is the opening; watch but do not tap and it is the promise or the offer; tap and do not buy and it is the page or the price. i went through that read properly in the piece on whether it is the hook, so only the part that matters here: it tells you what to make next. it does not tell you which ad won.
that is also the answer to one of the questions above. "anyone seen a "high ctr, low atc" pattern get fixed by creative tone alone, or is it usually something else entirely once you dig in?" — a high click rate with a low cart rate is an ad that did its job and a page that did not. the ad is not the thing to change. somebody writing about exactly this kind of misdiagnosis listed where to look instead: "whatever broke is downstream: landing page, offer, price, out of stock, or tracking".
and it answers the question of where the bigger impact is, paid-social click rate or product-page conversion. they are different steps on the same line. raising the click rate on an ad whose clicks do not buy is paying to send more of the wrong people to a page that already is not converting them.
the one person in the pile who described a clean test tracked the right set: "i tracked cost per usable asset, thumbnail stop rate, hold rate on the video, and cost per purchase." that is every step, watched. the only thing that changes when you do this properly is which one of them gets the vote.
The money number lies too, in three specific ways
getting from the click rate down to the money is most of the fix. it is not all of it, because the money figures have their own ways of pointing at the wrong ad.
one: cost per purchase does not know what the order was worth. the question in the pile that saw this coming: "do you cut on cpa, on roas, or do you look at what size orders a creative brings in?" if every order is the same size, cost per purchase and return on spend agree and it does not matter which you use. the moment one ad is selling the single item and another is selling the bundle, cost per purchase will crown the single-item ad — each order is cheaper to win — while the bundle ad is bringing in more money per dollar spent. if your order sizes vary, decide on return on spend at the ad level, not cost per purchase.
two: the ad account credits the ad for people who were already coming. two questions from one thread, both exactly right: "did it bring new customers or cheap retargeting conversions?" and "did backend revenue match platform reporting?" an ad that mostly reaches people who were already on their way to buying will post a lovely return on spend and add very little. i went through how the platform's reported number drifts from the business in the piece on letting the platform run the campaign, so i will not redo it; the only part that belongs here is that the number on the ad is the platform's opinion of the ad, and the platform is marking its own homework.
three, which is the fix for two: check the winner against the business, not against the dashboard. somebody asked the clean version: "are you still primarily using platform roas or have you moved to something blended?"
the answer is both, because they do different jobs. the platform figures are the only ones that exist per creative, so they are what you rank creatives with — there is no other option. the blended figure only exists for the whole business, so it cannot rank ads at all, but it can tell you whether promoting the winner did anything. the arithmetic is as simple as it sounds: "if you spent $10k on ads and drove $40k in shopify revenue, your mer is 4x." and the same idea for cost: "blended cac = total ad spend divided by total orders from shopify for the same period, not meta's cost per purchase."
so the winner gets its scaling budget, and then you watch whether the business moved. if the creative won on the platform and the store's revenue did not change when it got the money, it did not win. it was taking credit.
one caution on that check, so it does not become a new way to fool yourself: the blended figure moves for a dozen reasons that are nothing to do with the ad — an email, a price change, a sale, the week of the month. it is a sanity check on a promotion, not a verdict on a creative.
and the money number needs a line under it that comes from the business, not from the dashboard. the best example in the pile was somebody working it out from their own economics: "we can justify up to ~$20 per new purchase", because of take rate and repeat buying. that is what a real bar looks like — set from margin before the test, not read off whichever ad did best after it.
The whole thing on one account
here is all of it on one test. the numbers are constructed so the arithmetic is clean; the shape is the one those nine threads describe.
a store is testing three new videos, each in its own ad set at $100 a day, for a fortnight. about $1,400 goes behind each one. the store sells a single item and a bundle, so order sizes vary. before launch, two things are written down: the deciding number is return on spend at the ad level, because order sizes vary, and the bar is 1.0 on the first purchase, because repeat buying covers the rest of what they need.
(the $1,400 is the test. the three videos themselves shouldn't be the expensive part: https://clear-cortex.com/playbooks/how-to-make-an-ad?src=x-which-number-mid)
there was a fourth video. by day three almost nobody was getting past its opening — a hook rate under a third of the other three. it was switched off. that is the only thing a soft number was allowed to do in this test, and it did it.
after the fortnight, the three that stayed, at a $20 cost per thousand impressions, so about 70,000 impressions each:
- video a — click rate 3.8%, so about 2,660 clicks. 18 purchases. cost per purchase about $78. average order $48, so $864 back. return on spend 0.62.
- video b — click rate 1.2%, so about 840 clicks. 28 purchases. cost per purchase $50. average order $52, so $1,456 back. return on spend 1.04.
- video c — click rate 2.1%, so about 1,470 clicks. 32 purchases. cost per purchase about $44. average order $34, so $1,088 back. return on spend 0.78.
now read it three ways.
on click rate, a wins by a mile. more than three times video b's click rate, and the first thing anyone opening the dashboard would see. it turned 2,660 clicks into 18 orders. less than one click in a hundred bought.
on cost per purchase, c wins. the cheapest sales in the test. but they are mostly the single item, at $34 an order, and every dollar behind c brought back 78 cents.
on return on spend, b wins, and it is the only one over the bar. it had the worst click rate in the test by a distance. roughly one click in thirty bought, and the orders were the bundle. it looked like the loser on the first screen of the dashboard and it is the only ad that paid for itself.
three figures, three winners, and they are all real. that is why the deciding one has to be chosen before anybody sees the results, because afterwards there is always something available to justify any of the three.
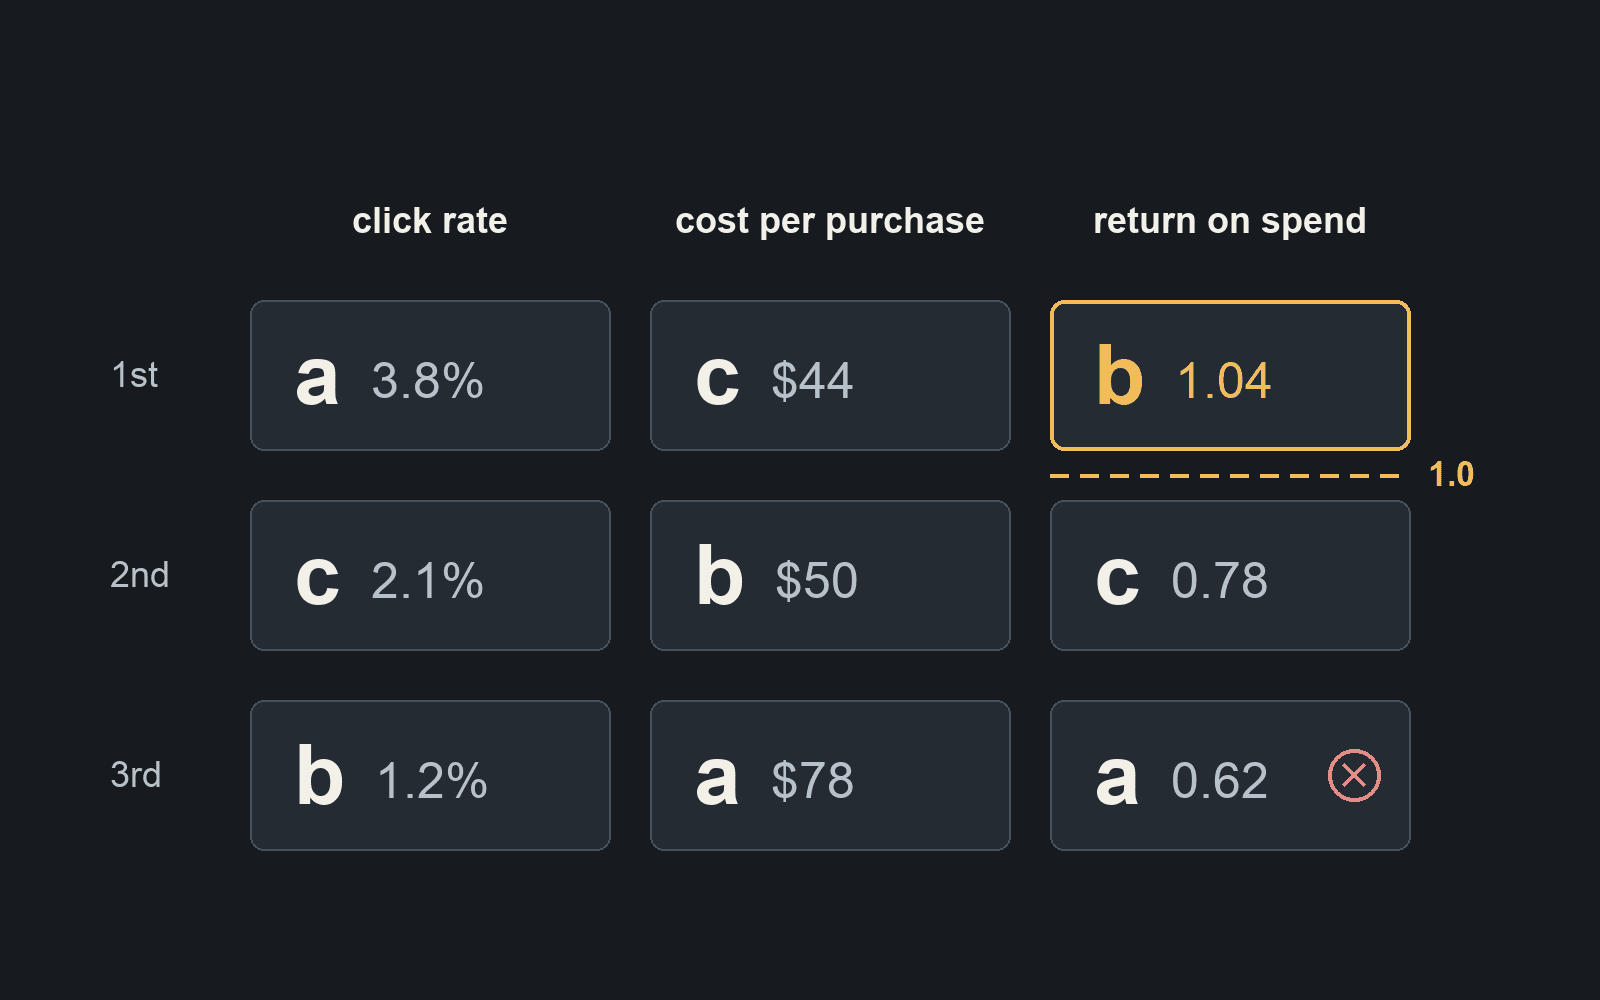
Constructed example. Same spend behind each video; the numbers are chosen so the arithmetic is clean.
here is what picking wrong costs. say the winner gets $300 a day for a month in the scaling campaign — $9,000. at a's rate that brings back about $5,580. at b's it brings back about $9,360. that is roughly $3,780 of difference, from choosing the ad with the best click rate over the ad with the best return. rates never hold perfectly when budget goes up, so treat that as the shape of the loss rather than a forecast, but the direction does not change: the click rate would have put the whole month's scaling budget behind the video that sold least.
and b is not finished yet. it goes into the scaling campaign, and for the next fortnight the store's own revenue divided by total ad spend gets compared against the fortnight before. if it holds or rises, b won. if it sits flat while b's platform return stays pretty, b was mostly collecting people who were coming anyway, and the next candidate gets the budget with the same check waiting for it. i cannot tell you which way it goes here, because the example is constructed and constructed accounts do not have a next fortnight.
The part i cannot prove
none of this method is mine. the line from attention to money is how any funnel works, the ad-level-versus-blended split is ordinary practice, and the ten-per-week floor is arithmetic on platform mechanics that i wrote up elsewhere. i do not run an account at this spend, and if i pretended otherwise the first person to ask which one would end it.
the worked example is constructed so the arithmetic is clean. the quotes are other people's, taken from what they wrote about their own campaigns — the rising click rate with the cost per acquisition up almost thirty per cent, the elite platform metrics converting nobody, the $150 a day with a handful of purchases a week. those are real accounts. mine is not one of them.
i also cannot show you that the easy numbers and the money run in opposite directions in general. the one large dataset that claims it is not one i can check, and the people who published it asked the room the same question. what i am claiming is smaller: they measure different things, and the creative that wins one does not have to be the creative that wins the other.
and there is one thing i genuinely do not know. the move-up-one-step rule assumes add to cart is a decent stand-in for a purchase on your account. how decent varies with price, with product, with how long people take to decide — on a higher-priced product the cart can be weeks ahead of the sale. i do not know where it stops being a useful stand-in. if you have checked how your cart rate lines up with your purchases, i would rather have your number than be right.
if any of this is wrong, say so. a correction is worth more to me than agreement.
a fair test needs more than one video in it, and three videos shouldn't cost more than the budget behind them. that's the part clear cortex does: https://clear-cortex.com/?src=x-which-number-end